|
...making Linux just a little more fun! |
By Pradeep Padala |
If you have read my previous article on GD, you might have noticed that creating charts with the GD module is cumbersome. (That article also contains some general information about loading Perl modules.) Martien Verbruggen has created the GD::Graph module that allows easy creation of charts. This module has useful functions to create various types of charts such as bar charts, pie charts, line charts etc... The module is very useful in creating dynamic charts depicting network statistics, web page access statistics etc...
In this article, I will describe a general way of using the module and also show a few examples of creating various charts.
A perl script using GD::Graph to create charts typically contains the following things:
$mygraph = GD::Graph::chart->new($width, $height);
where chart can be bars, lines, points, linespoints,
mixed or pie. For example, if you wanted a bar chart, you
would use
$mygraph = GD::Graph::bars->new($width, $height);
$myimage = $mygraph->plot(\@data);
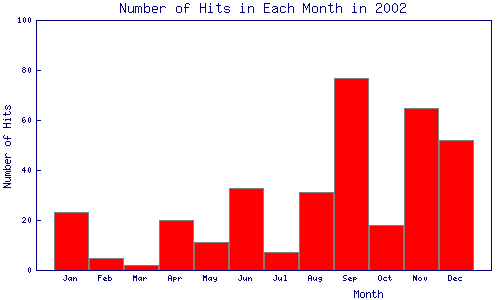
Let's draw a simple chart following above steps. This script uses CGI to output
the image on to a web page.
[Text version of this listing.]
#!/usr/local/bin/perl -w
# Change above line to point to your perl binary

use CGI ':standard';
use GD::Graph::bars;
use strict;

# Both the arrays should same number of entries.
my @data = (["Jan", "Feb", "Mar", "Apr", "May", "Jun", "Jul", "Aug",
             "Sep", "Oct", "Nov", "Dec"],
            [23, 5, 2, 20, 11, 33, 7, 31, 77, 18, 65, 52]);

my $mygraph = GD::Graph::bars->new(500, 300);
$mygraph->set(
    x_label     => 'Month',
    y_label     => 'Number of Hits',
    title       => 'Number of Hits in Each Month in 2002',
) or warn $mygraph->error;

my $myimage = $mygraph->plot(\@data) or die $mygraph->error;

print "Content-type: image/png\n\n";
print $myimage->png;
The output of the program can be seen here
The above program is pretty much self-explanatory. The @data
variable
is an array of arrays. The first array represents the labels on X-axis and all
the subsequent arrays present different datasets.
As you can see, the graph produced by above program is quite bland and simple. We can tweak various options to produce better looking and customized graphs. There are a multitude of options to control the various aspects of the graph. Options are divided into two types: the options common to all types of graphs, and the options specific to each type of graph.
Options can be set while creating the graph or with
$mygraph->set(attrib1 => value1, attrib2 => value2, ...);
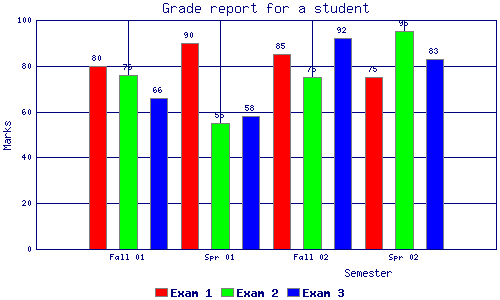
Let us write a script setting legends, a grid and few options.
[Text version of this listing.]
#!/usr/local/bin/perl -w
# Change above line to point to your perl binary

use CGI ':standard';
use GD::Graph::bars;
use strict;

# Both the arrays should same number of entries.
my @data = (['Fall 01', 'Spr 01', 'Fall 02', 'Spr 02' ],
            [80, 90, 85, 75],
            [76, 55, 75, 95],
            [66, 58, 92, 83]);

my $mygraph = GD::Graph::bars->new(500, 300);
$mygraph->set(
    x_label     => 'Semester',
    y_label     => 'Marks',
    title       => 'Grade report for a student',
    # Draw bars with width 3 pixels
    bar_width   => 3,
    # Sepearte the bars with 4 pixels
    bar_spacing => 4,
    # Show the grid
    long_ticks  => 1,
    # Show values on top of each bar
    show_values => 1,
) or warn $mygraph->error;

$mygraph->set_legend_font(GD::gdMediumBoldFont);
$mygraph->set_legend('Exam 1', 'Exam 2', 'Exam 3');
my $myimage = $mygraph->plot(\@data) or die $mygraph->error;

print "Content-type: image/png\n\n";
print $myimage->png;
The output of above program can be seen here
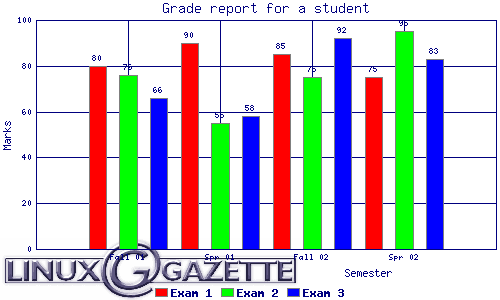
Again as you can see, GD::Graph provides a flexible to way to create customized graphs. Let's prepare another chart with a logo.
Text version of the file can be found here
#!/usr/local/bin/perl -w
# Change above line to point to your perl binary

use CGI ':standard';
use lib '/cise/homes/ppadala/mydepot/lib/perl5/site_perl';
use GD::Graph::bars;
use strict;

# Both the arrays should same number of entries.
my @data = (['Fall 01', 'Spr 01', 'Fall 02', 'Spr 02' ],
            [80, 90, 85, 75],
            [76, 55, 75, 95],
            [66, 58, 92, 83]);

my $mygraph = GD::Graph::bars->new(500, 300);
$mygraph->set(
    x_label     => 'Semester',
    y_label     => 'Marks',
    title       => 'Grade report for a student',
    # Draw bars with width 3 pixels
    bar_width   => 3,
    # Sepearte the bars with 4 pixels
    bar_spacing => 4,
    # Show the grid
    long_ticks  => 1,
    # Show values on top of each bar
    show_values => 1,
) or warn $mygraph->error;

$mygraph->set(logo => 'lglogo.png');
$mygraph->set(logo_resize => 0.5);
$mygraph->set(logo_position => 'LL');
$mygraph->set_legend_font(GD::gdMediumBoldFont);
$mygraph->set_legend('Exam 1', 'Exam 2', 'Exam 3');
my $myimage = $mygraph->plot(\@data) or die $mygraph->error;
print "Content-type: image/png\n\n";
print $myimage->png;
Output of above program can be seen here
Here's the Linux Gazette logo I used. It's in PNG format. The current version of GD::Graph doesn't recognize any image types besides GIF (although it can write PNG, go figure). I submitted a patch to fix this. You can either apply the patch or use an older version of GD or GD::Graph.
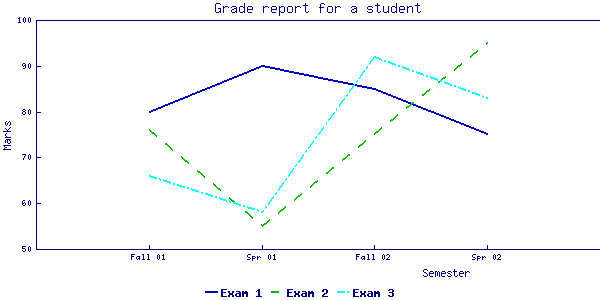
Some information can be better presented with line graphs. Here's an
example showing a line graph.
[Text version of this listing.]
#!/usr/local/bin/perl -w
# Change above line to point to your perl binary

use CGI ':standard';
use GD::Graph::lines;
use strict;

# Both the arrays should same number of entries.
my @data = (['Fall 01', 'Spr 01', 'Fall 02', 'Spr 02' ],
            [80, 90, 85, 75],
            [76, 55, 75, 95],
            [66, 58, 92, 83]);

my $mygraph = GD::Graph::lines->new(600, 300);
$mygraph->set(
    x_label     => 'Semester',
    y_label     => 'Marks',
    title       => 'Grade report for a student',
    # Draw datasets in 'solid', 'dashed' and 'dotted-dashed' lines
    line_types  => [1, 2, 4],
    # Set the thickness of line
    line_width  => 2,
    # Set colors for datasets
    dclrs       => ['blue', 'green', 'cyan'],
) or warn $mygraph->error;

$mygraph->set_legend_font(GD::gdMediumBoldFont);
$mygraph->set_legend('Exam 1', 'Exam 2', 'Exam 3');
my $myimage = $mygraph->plot(\@data) or die $mygraph->error;

print "Content-type: image/png\n\n";
print $myimage->png;
Output of above program can be seen here
Here I have used GD::Graph::lines to create the graph handle. But for this change, the program follows the same pattern for creating graphs.
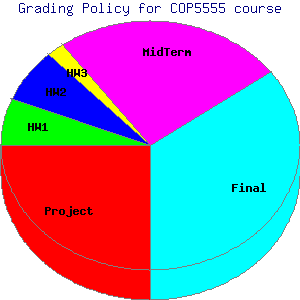
Similarly we can create a pie chart.
[Text version of this listing.]
#!/usr/local/bin/perl -w
# Change above line to point to your perl binary

use CGI ':standard';
use GD::Graph::pie;
use strict;

# Both the arrays should same number of entries.
my @data = (['Project', 'HW1', 'HW2', 'HW3', 'MidTerm', 'Final'],
            [25, 6, 7, 2, 25, 35]);

my $mygraph = GD::Graph::pie->new(300, 300);
$mygraph->set(
    title       => 'Grading Policy for COP5555 course',
    '3d'          => 1,
) or warn $mygraph->error;

$mygraph->set_value_font(GD::gdMediumBoldFont);
my $myimage = $mygraph->plot(\@data) or die $mygraph->error;

print "Content-type: image/png\n\n";
print $myimage->png;
The output pie chart can be seen here
The '3d' option draws the pie chart in 3d.
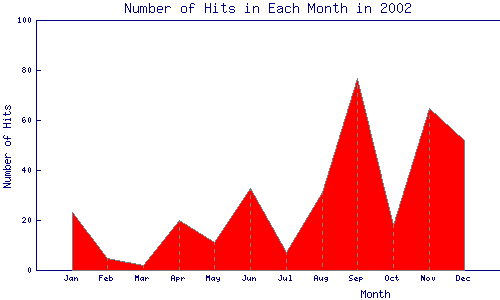
An area graph shows the data as area under a line.
[Text version of this listing.]
#!/usr/local/bin/perl -w
# Change above line to point to your perl binary

use CGI ':standard';
use GD::Graph::area;
use strict;

# Both the arrays should same number of entries.
my @data = (["Jan", "Feb", "Mar", "Apr", "May", "Jun", "Jul", "Aug",
             "Sep", "Oct", "Nov", "Dec"],
            [23, 5, 2, 20, 11, 33, 7, 31, 77, 18, 65, 52]);

my $mygraph = GD::Graph::area->new(500, 300);
$mygraph->set(
    x_label     => 'Month',
    y_label     => 'Number of Hits',
    title       => 'Number of Hits in Each Month in 2002',
) or warn $mygraph->error;

my $myimage = $mygraph->plot(\@data) or die $mygraph->error;

print "Content-type: image/png\n\n";
print $myimage->png;
Output image can be seen here
The GD::Graph module provides a powerful and flexible way to create charts. It's very useful for creating graphs dynamically for serving on web.
I hope you have enjoyed reading this article. Next month, we will have a look at the PerlMagic Module.